- Filter By:
-
-
Stock photos and images of username:Maximusnd
Data on a monitor which including of Market Analyze. Bar graphs, Diagrams, financial figures.
Stock PhotoUsername
MaximusndResolution
8858x4724pxData on a monitor which including of Market Analyze. Bar graphs, Diagrams, financial figures.

Programming source code HTML for Website development. Server logs analysis.
Stock PhotoUsername
MaximusndResolution
8858x4724pxProgramming source code HTML for Website development. Server logs analysis.


Stock market investment trading. The Forex graph chart on the digital screen.
Stock PhotoUsername
MaximusndResolution
8858x4724pxStock market investment trading. The Forex graph chart on the digital screen.

Stock market investment trading. The Forex graph chart on the digital screen.
Stock PhotoUsername
MaximusndResolution
8858x4724pxStock market investment trading. The Forex graph chart on the digital screen.

Abstract finance background. Stock market graph on led screen. Finance and investment concept.
Stock PhotoUsername
MaximusndResolution
8858x4724pxAbstract finance background. Stock market graph on led screen. Finance and investment concept.
Economy trends background for business idea and all art work design. Abstract finance background.
Stock PhotoUsername
MaximusndResolution
8858x4724pxEconomy trends background for business idea and all art work design. Abstract finance background.
Concept of stock market and fintech.Abstract financial trading graphs on monitor.
Stock PhotoUsername
MaximusndResolution
8858x4724pxConcept of stock market and fintech.Abstract financial trading graphs on monitor.

Stock market investment trading. The Forex graph chart on the digital screen.
Stock PhotoUsername
MaximusndResolution
8858x4724pxStock market investment trading. The Forex graph chart on the digital screen.


Currency exchange rate for world currency: US Dollar, Euro, Frank, Yen. Financial, money, global finance, stock market background
Stock PhotoUsername
MaximusndResolution
8858x4724pxCurrency exchange rate for world currency: US Dollar, Euro, Frank, Yen. Financial, money, global finance, stock market background

Analysis for professional technical analysis on the monitor of a computer. Fundamental and technical analysis concept.
Stock PhotoUsername
MaximusndResolution
8858x4724pxAnalysis for professional technical analysis on the monitor of a computer. Fundamental and technical analysis concept.


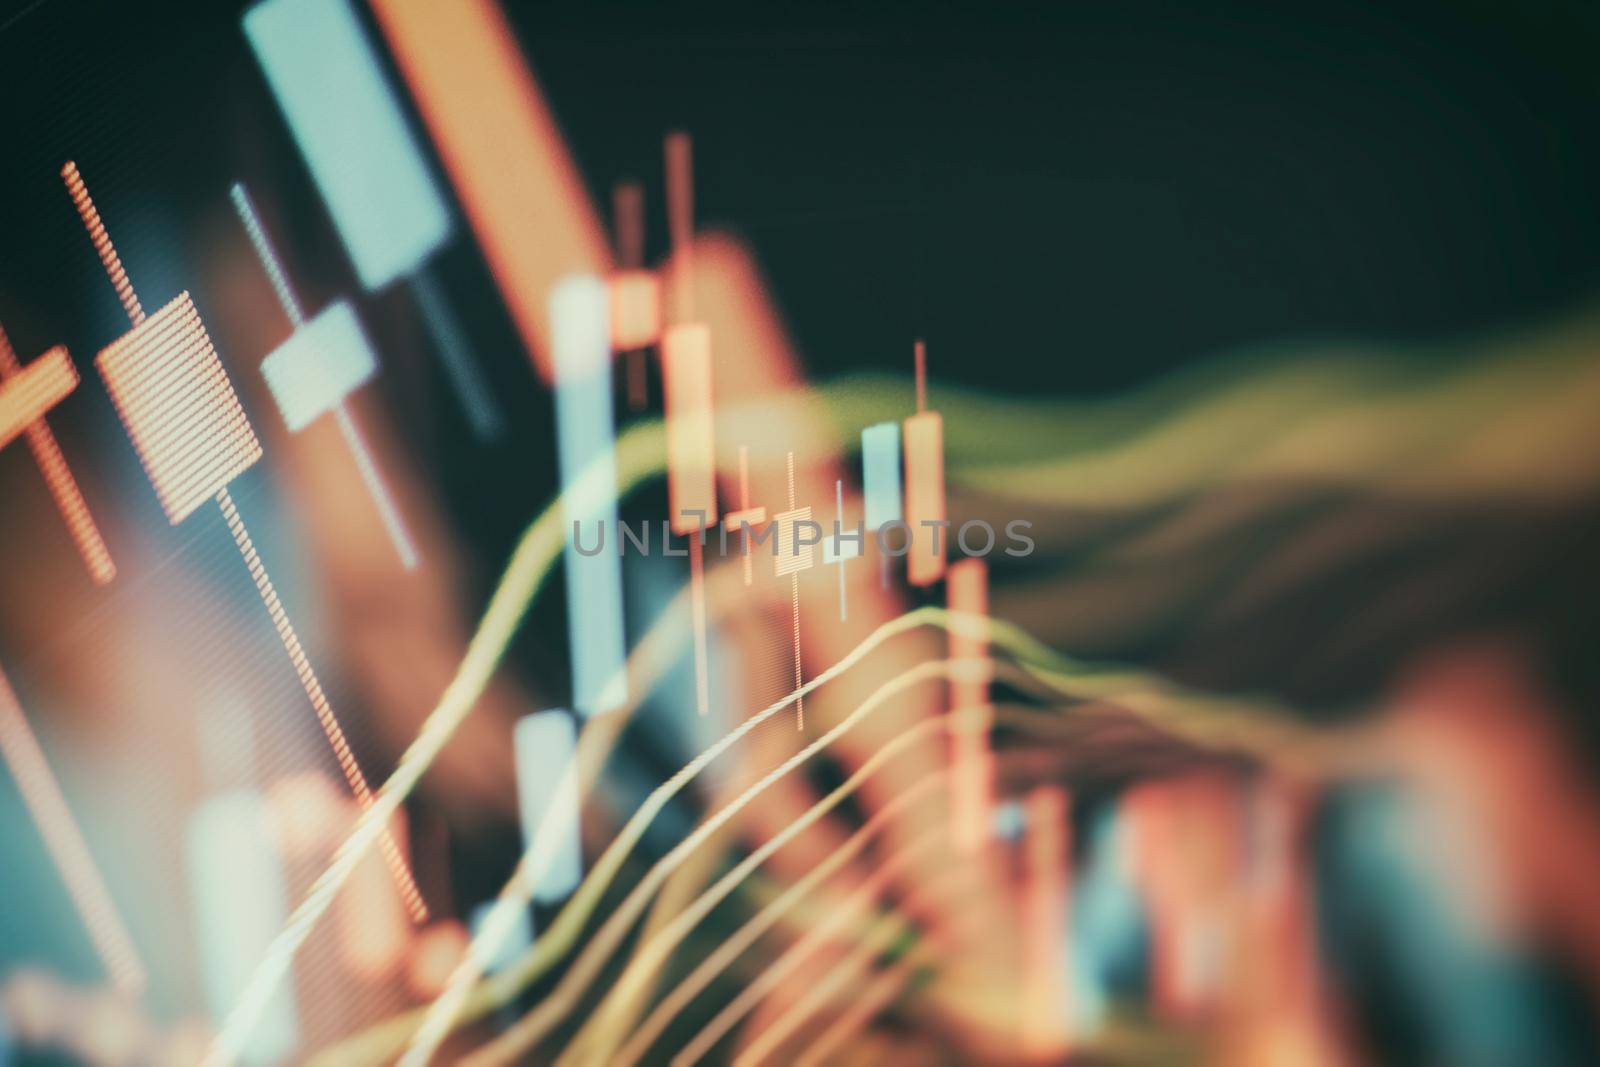
Market Analyze. Bar graphs, Diagrams, financial figures. Abstract glowing forex chart interface wallpaper. Investment, trade, stock, finance
Stock PhotoUsername
MaximusndResolution
8858x4724pxMarket Analyze. Bar graphs, Diagrams, financial figures. Abstract glowing forex chart interface wallpaper. Investment, trade, stock, finance

Analysis for professional technical analysis on the monitor of a computer. Fundamental and technical analysis concept.
Stock PhotoUsername
MaximusndResolution
8858x4724pxAnalysis for professional technical analysis on the monitor of a computer. Fundamental and technical analysis concept.
Stock market investment trading. The Forex graph chart on the digital screen.
Stock PhotoUsername
MaximusndResolution
8858x4724pxStock market investment trading. The Forex graph chart on the digital screen.

Businessman hand working on analyzing investment charts for Gold market, Forex market and Trading market.
Stock PhotoUsername
MaximusndResolution
8192x4608pxBusinessman hand working on analyzing investment charts for Gold market, Forex market and Trading market.


Businessman hand working on analyzing investment charts for Gold market, Forex market and Trading market.
Stock PhotoUsername
MaximusndResolution
8858x4724pxBusinessman hand working on analyzing investment charts for Gold market, Forex market and Trading market.

Analysis for professional technical analysis on the monitor of a computer. Fundamental and technical analysis concept.
Stock PhotoUsername
MaximusndResolution
8858x4724pxAnalysis for professional technical analysis on the monitor of a computer. Fundamental and technical analysis concept.
Analysis for professional technical analysis on the monitor of a computer. Fundamental and technical analysis concept.
Stock PhotoUsername
MaximusndResolution
8858x4724pxAnalysis for professional technical analysis on the monitor of a computer. Fundamental and technical analysis concept.

Market Analyze. Bar graphs, Diagrams, financial figures. Abstract glowing forex chart interface wallpaper. Investment, trade, stock, finance
Stock PhotoUsername
MaximusndResolution
8858x4724pxMarket Analyze. Bar graphs, Diagrams, financial figures. Abstract glowing forex chart interface wallpaper. Investment, trade, stock, finance

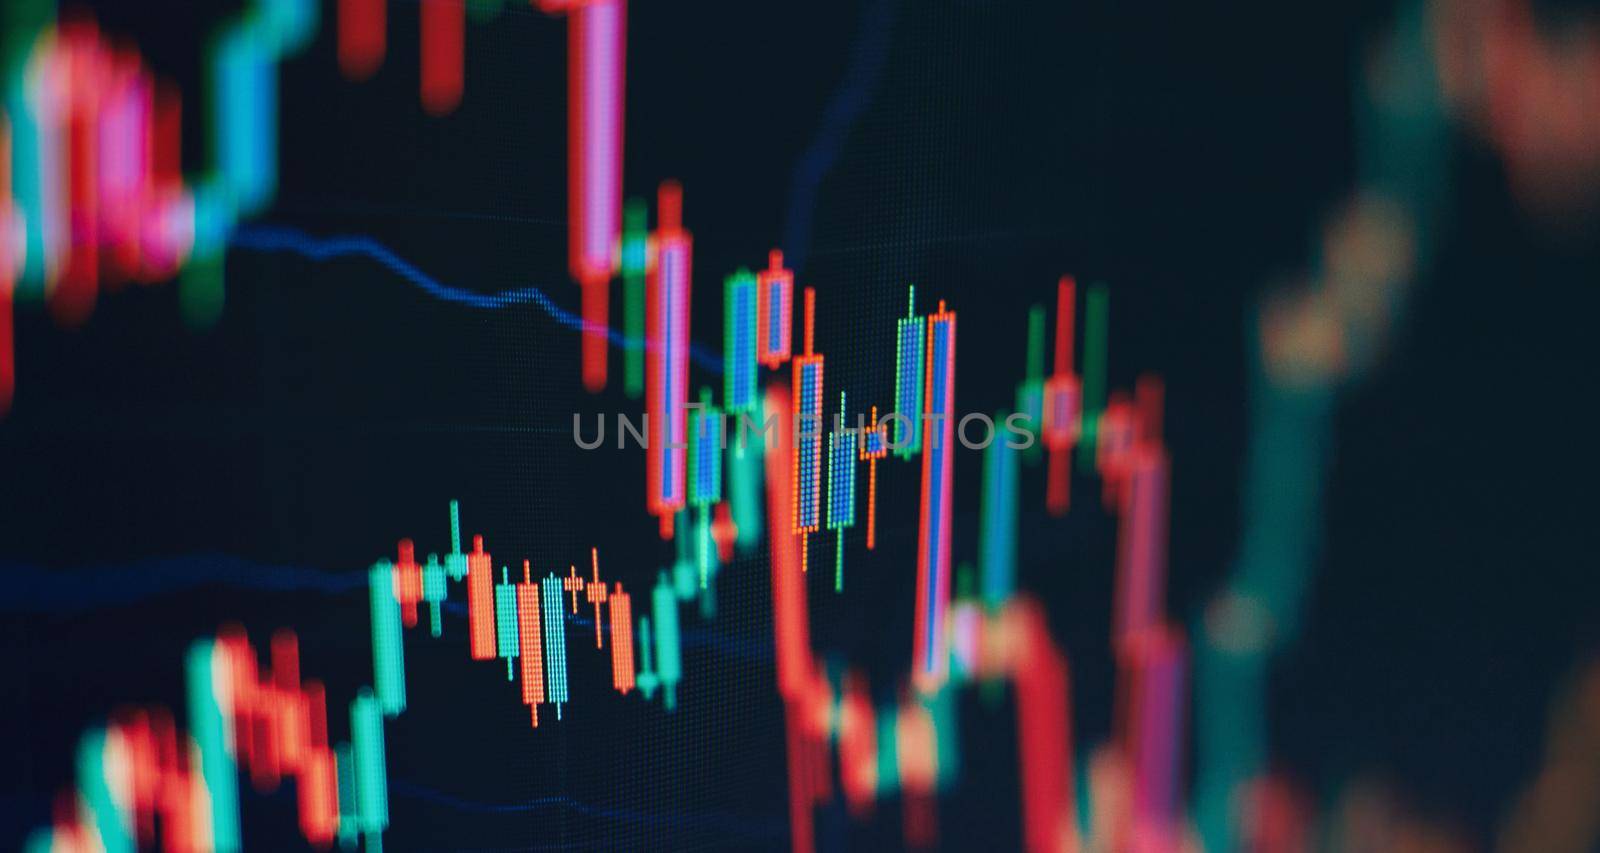
Technical price graph and indicator, red and green candlestick chart on blue theme screen, market volatility, up and down trend. Stock trading, crypto currency background.
Stock PhotoUsername
MaximusndResolution
8858x4724pxTechnical price graph and indicator, red and green candlestick chart on blue theme screen, market volatility, up and down trend. Stock trading, crypto currency background.
Market Analyze. Bar graphs, Diagrams, financial figures. Abstract glowing forex chart interface wallpaper. Investment, trade, stock, finance
Stock PhotoUsername
MaximusndResolution
8858x4724pxMarket Analyze. Bar graphs, Diagrams, financial figures. Abstract glowing forex chart interface wallpaper. Investment, trade, stock, finance

Economic growth, recession. Electronic virtual platform showing trends and stock market fluctuations
Stock PhotoUsername
MaximusndResolution
8858x4724pxEconomic growth, recession. Electronic virtual platform showing trends and stock market fluctuations

Abstract graphic consisting of blured points , graph and chart . Information concept .
Stock PhotoUsername
MaximusndResolution
8858x4724pxAbstract graphic consisting of blured points , graph and chart . Information concept .

Concept of stock market and fintech. Blurry digital charts over dark blue background.
Stock PhotoUsername
MaximusndResolution
5472x3648pxConcept of stock market and fintech. Blurry digital charts over dark blue background.


Concept of stock market and fintech. Blurry digital charts over dark blue background.
Stock PhotoUsername
MaximusndResolution
5472x3648pxConcept of stock market and fintech. Blurry digital charts over dark blue background.
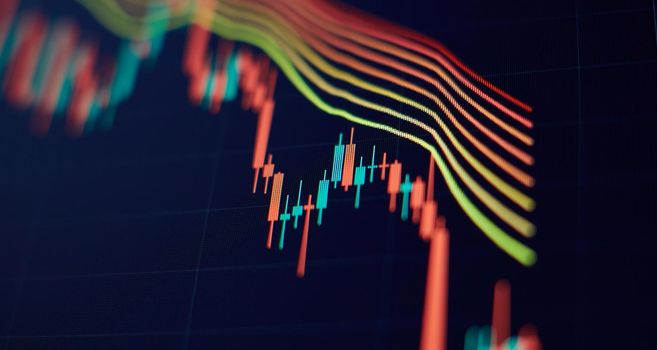
forex trading graph and candlestick chart suitable for financial investment concept. Economy trends background for business idea and all art work design. Abstract finance background.
Stock PhotoUsername
MaximusndResolution
8858x4724pxforex trading graph and candlestick chart suitable for financial investment concept. Economy trends background for business idea and all art work design. Abstract finance background.


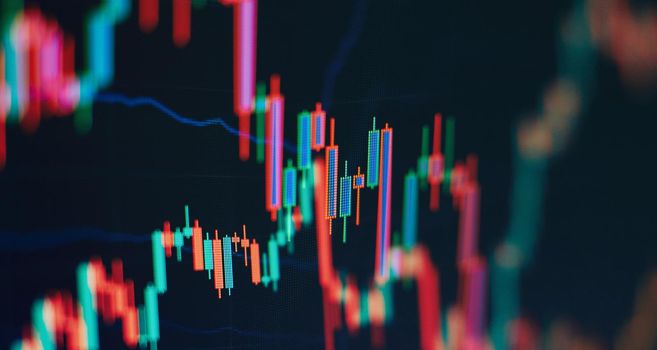
graph and indicator, red and green candlestick chart on blue theme screen, market volatility, up and down trend. Stock trading, crypto currency background.
Stock PhotoUsername
MaximusndResolution
8858x4724pxgraph and indicator, red and green candlestick chart on blue theme screen, market volatility, up and down trend. Stock trading, crypto currency background.


Economic graph with diagrams on the stock market, for business and financial concepts and reports.
Stock PhotoUsername
MaximusndResolution
8858x4724pxEconomic graph with diagrams on the stock market, for business and financial concepts and reports.


Economic graph with diagrams on the stock market, for business and financial concepts
Stock PhotoUsername
MaximusndResolution
8858x4724pxEconomic graph with diagrams on the stock market, for business and financial concepts


web developing programming language for website coding. mixed media background
Stock PhotoUsername
MaximusndResolution
7680x4320pxweb developing programming language for website coding. mixed media background


Economic graph with diagrams on the stock market, for business and financial concepts and reports.
Stock PhotoUsername
MaximusndResolution
8858x4724pxEconomic graph with diagrams on the stock market, for business and financial concepts and reports.


Volume analysis for professional technical analysis on the monitor of a computer. Fundamental and technical analysis concept.
Stock PhotoUsername
MaximusndResolution
5472x3648pxVolume analysis for professional technical analysis on the monitor of a computer. Fundamental and technical analysis concept.

Businessman hand working on analyzing investment charts for Gold market, Forex market and Trading market.
Stock PhotoUsername
MaximusndResolution
8858x4724pxBusinessman hand working on analyzing investment charts for Gold market, Forex market and Trading market.


The business plan at the meeting and analyze financial numbers to view the performance of the company.
Stock PhotoUsername
MaximusndResolution
8858x4724pxThe business plan at the meeting and analyze financial numbers to view the performance of the company.

Abstract graphic consisting of blured points , graph and chart . Information concept .
Stock PhotoUsername
MaximusndResolution
8858x4724pxAbstract graphic consisting of blured points , graph and chart . Information concept .


Economic growth, recession. Electronic virtual platform showing trends and stock market fluctuations
Stock PhotoUsername
MaximusndResolution
8858x4724pxEconomic growth, recession. Electronic virtual platform showing trends and stock market fluctuations

Economic growth, recession. Electronic virtual platform showing trends and stock market fluctuations
Stock PhotoUsername
MaximusndResolution
8858x4724pxEconomic growth, recession. Electronic virtual platform showing trends and stock market fluctuations

The business plan at the meeting and analyze financial numbers to view the performance of the company.
Stock PhotoUsername
MaximusndResolution
8858x4724pxThe business plan at the meeting and analyze financial numbers to view the performance of the company.


web developing programming language for website coding. mixed media background
Stock PhotoUsername
MaximusndResolution
7680x4320pxweb developing programming language for website coding. mixed media background


Concept of stock market and fintech. Blurry digital charts over dark blue background.
Stock PhotoUsername
MaximusndResolution
8858x4724pxConcept of stock market and fintech. Blurry digital charts over dark blue background.

web developing programming language for website coding. mixed media background
Stock PhotoUsername
MaximusndResolution
5315x3543pxweb developing programming language for website coding. mixed media background


Volume analysis for professional technical analysis on the monitor of a computer. Fundamental and technical analysis concept.
Stock PhotoUsername
MaximusndResolution
8858x4724pxVolume analysis for professional technical analysis on the monitor of a computer. Fundamental and technical analysis concept.

The business plan at the meeting and analyze financial numbers to view the performance of the company.
Stock PhotoUsername
MaximusndResolution
5472x3648pxThe business plan at the meeting and analyze financial numbers to view the performance of the company.

Digital graph interface over dark blue background. Concept of stock market and financial success.
Stock PhotoUsername
MaximusndResolution
8858x4724pxDigital graph interface over dark blue background. Concept of stock market and financial success.


Digital graph interface over dark blue background. Concept of stock market and financial success.
Stock PhotoUsername
MaximusndResolution
8858x4724pxDigital graph interface over dark blue background. Concept of stock market and financial success.

Stock market business graph chart on digital screen.Forex market, Gold market and Crude oil market .
Stock PhotoUsername
MaximusndResolution
5472x3648pxStock market business graph chart on digital screen.Forex market, Gold market and Crude oil market .

Technical price graph and indicator, red and green candlestick chart on blue theme screen, market volatility, up and down trend. Stock trading, crypto currency background.
Stock PhotoUsername
MaximusndResolution
8858x4724pxTechnical price graph and indicator, red and green candlestick chart on blue theme screen, market volatility, up and down trend. Stock trading, crypto currency background.


Charts of financial instruments with various type of indicators including volume analysis for professional technical analysis on the monitor of a computer.
Stock PhotoUsername
MaximusndResolution
8858x4724pxCharts of financial instruments with various type of indicators including volume analysis for professional technical analysis on the monitor of a computer.


Economic graph with diagrams on the stock market, for business and financial concepts and reports.
Stock PhotoUsername
MaximusndResolution
8858x4724pxEconomic graph with diagrams on the stock market, for business and financial concepts and reports.
